Constraint
The same canonical data source may be useful in more than one workspace, while models and reports need their own working context.
A collaborative analytics workspace built and operated by SwitchCase Studios, from data sources and visual models to reports and controlled embeds.
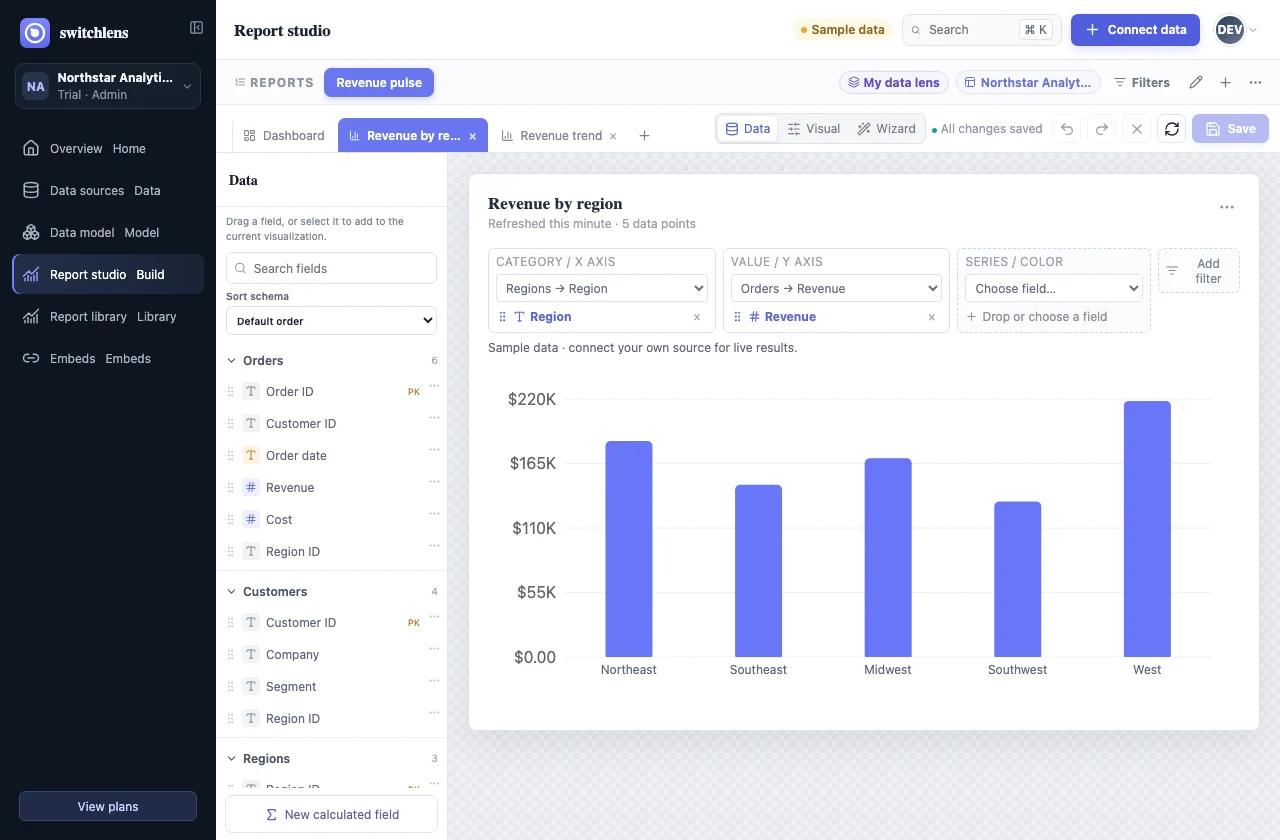
Reporting becomes difficult before a chart appears. Sources live in different systems, relationship logic gets buried, and a published visual can lose the context people need to trust it.
SwitchLens treats the workflow as one product system: connect PostgreSQL, MySQL, MariaDB, SQL Server, CSV, TXT, XLS, and XLSX sources; curate fields and model relationships; build tables, charts, KPIs, and dashboards; then publish individual visualizations to the intended audience.
The same canonical data source may be useful in more than one workspace, while models and reports need their own working context.
Datasource ownership is kept separate from workspace availability; relationships, calculated fields, filters, and report layouts remain workspace-local.
Separating source ownership from where it can be used adds explicit assignment and access decisions instead of copying a connection into every workspace.
Teams can reuse a governed source while keeping each workspace’s modeling and reporting choices in view.
Bring database, file, or JSON API data into a source catalog with explicit ownership.
Model the fields and relationships that explain how data can be combined.
Compose visual answers and share an individual visualization or dashboard with deliberate access boundaries.
No. It is an owned SwitchCase Studios product. The studio remains responsible for its product direction, experience, engineering, releases, security boundaries, billing, and operation.
The current product supports PostgreSQL, MySQL, MariaDB, SQL Server, CSV and TXT files, and XLS or XLSX workbooks. Source quantities and automated refresh capabilities vary by plan.
SwitchLens currently publishes one visualization at a time through an iframe. Authors can deliberately choose from available public or private audience modes; it does not present an entire interactive report as one embed.
The next move
SwitchCase can turn complex data rules into a focused product that stays understandable from source connection through controlled distribution.